Report Designer (cloud version)
Report creating
How to generate a report.
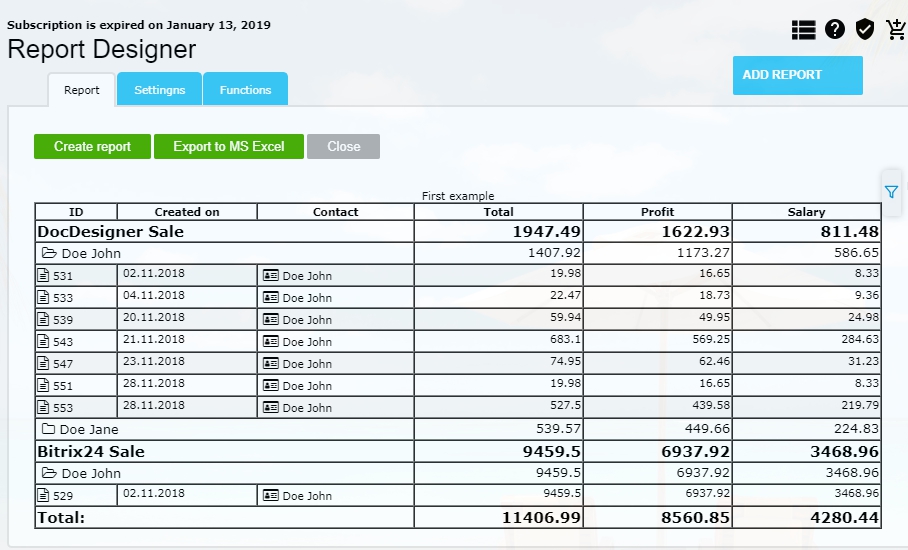
To generate a report, press "Create Report" button. Reports can be exported to MS Excel - press "Export to MS Excel" button for this.
Different levels of detalization are avilable in reports. Click  to access detailed data in a row. Double-click to hide detailed data.
You can open a card of a Deal (Invoice, Quote). Click any column in the row, which contains detailed data.
If the report contains a column with Company or Contact data, these columns are marked with  . Click this column to open Company or Contact Profile.
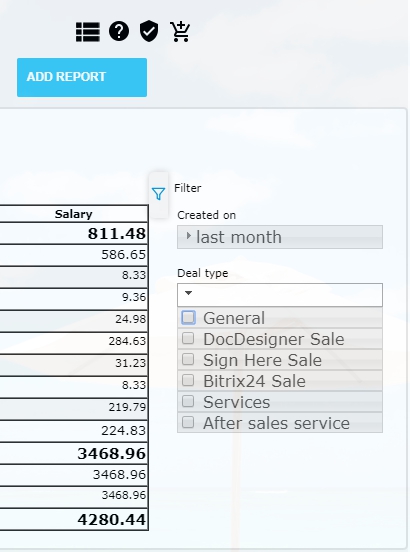
These is a filter on the right of generated report.
Click the filter to open customization settings.
Click the filter to open customization settings.
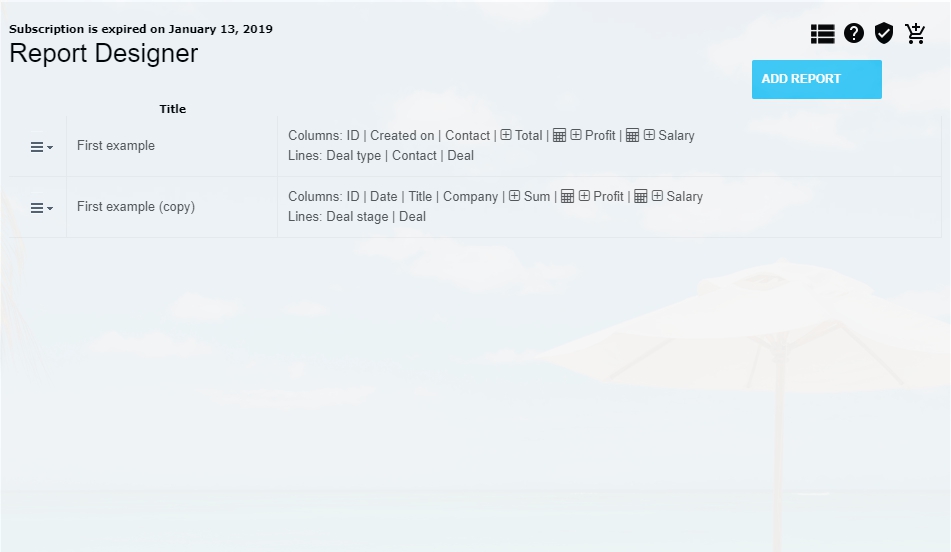
List of Reports
List of reports contains title and short description of the fields: rows and columns.The icon indicates calculated fields.
The icon
indicates summed up fields. Fields in a report are summed up and grouped.
Press "Add report" to add a new report.
Use context menu for necessary actions.
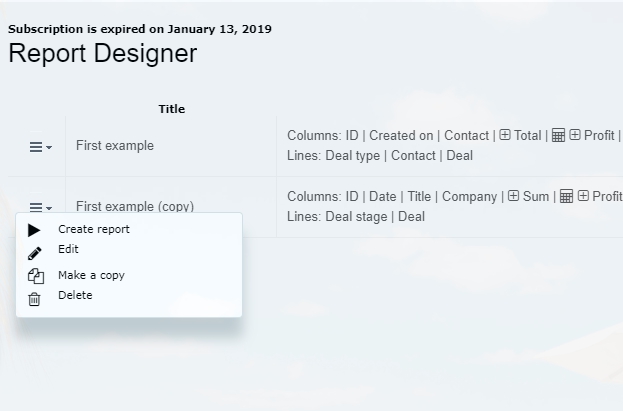
Creare report- to open the form of the report and to run it.
Edit - to open the form with report settings.
Make a Copy - to copy necessary report.
Delete - to delete the report form the database.
Edit - to open the form with report settings.
Make a Copy - to copy necessary report.
Delete - to delete the report form the database.
Report Settings
To set a new report, first of all you need to choose the source of data:
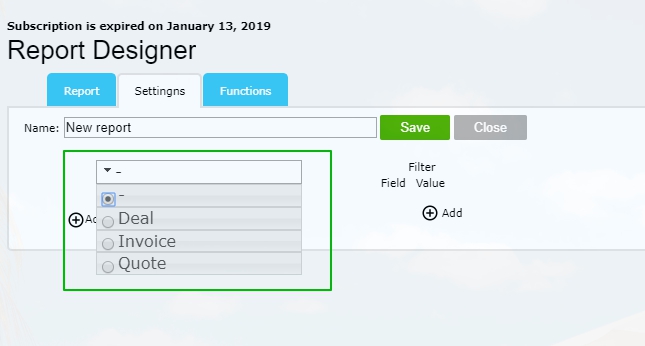
Currently, in Report Designer it is possible to make reports on the basis of Deals, Invoices, Quotes.
After choosing the source, the settings will be filled in with the correspondent data structure:
After choosing the source, the settings will be filled in with the correspondent data structure:
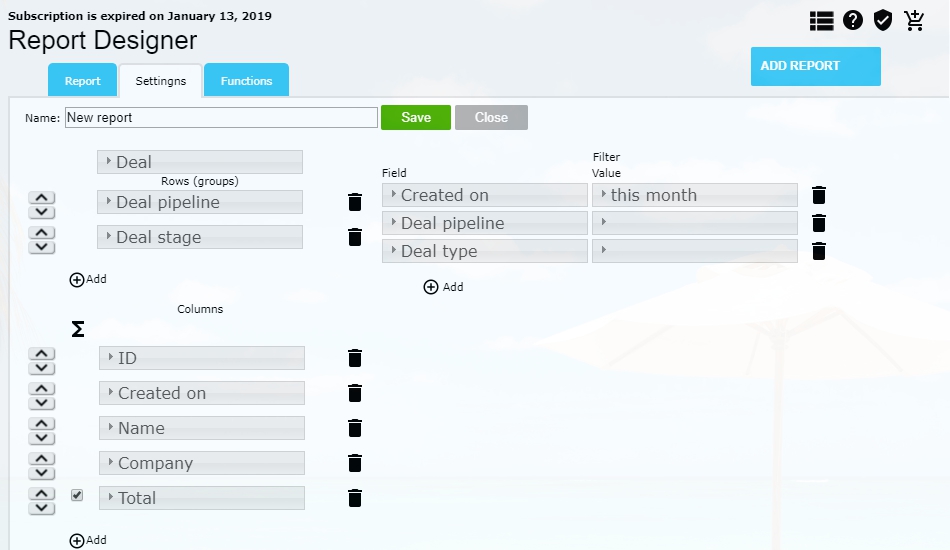
Rows
To add a row to the report use the block "Rows" and "Add" button.
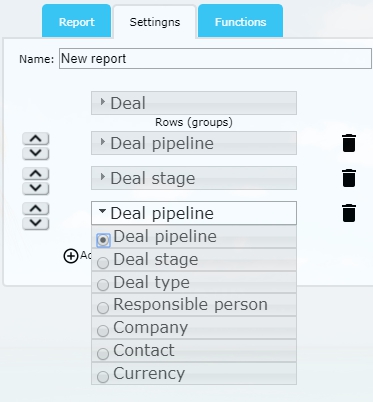
For grouping choose the type of data from the dropdown menu.
You can change grouping order with the "up/down" buttons ( / ).
You can delete grouping with the "delete" button .
Important: Currently, you can build reports with three levels of grouping.
You can change grouping order with the "up/down" buttons ( / ).
You can delete grouping with the "delete" button .
Important: Currently, you can build reports with three levels of grouping.
Columns
To add a column to the report use the block "Columns" and "Add" button.
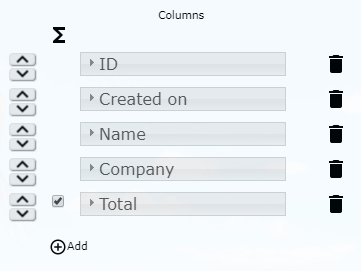
Choose the field from the dropdown menu.
You can change fields order with the "up/down" buttons ( / ).
You can delete a field with the "delete" button .
Fields with the numeric data can be summed up in a rows of a report. For total calculations in a column, mark the necessary field.
Important: For proper report display we recommed to place all calculated fields at the end of the report.
You can use calculated fields as columns of the report. Total calculations and grouping are also available for these fields.
Filters
You can set the fields to filter the report.
To add a field for the filter, use block "Filter" and "Add" button.
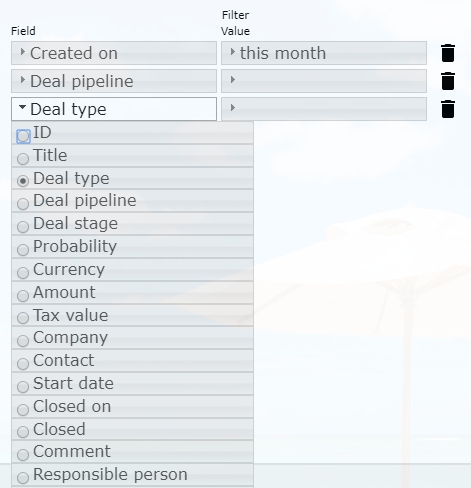
From the dropdown menu choose the field for filter in the report. Different parameters of a filter depend on the type of the field.
You can delete the field from the filter with the "Delete" button .
Functions
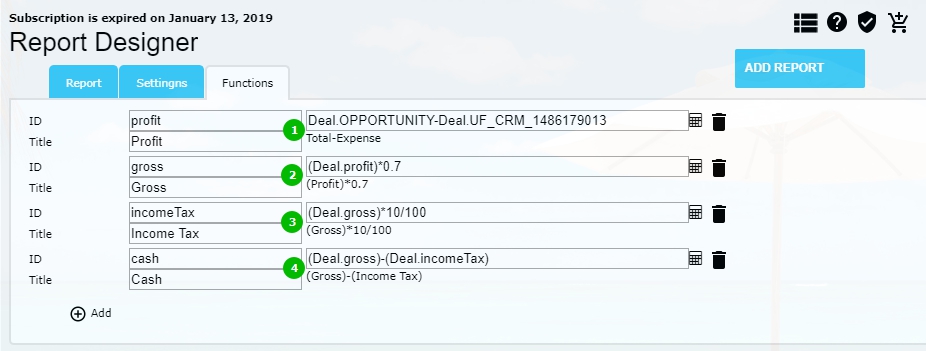
You can calculate data in the report using formulas.
Use tab "Formulas" to set the formula. Press  button. To display the parameter in the report, use the settings of the columns.

Identificator - the parameter's ID, needs to be filled in in English. Capital and lowercase letters are applicable.
Title - parameter's title, used in the menu. Any kind of symbols can be used.
Title - parameter's title, used in the menu. Any kind of symbols can be used.
To set formula, use the button with calculator .
The menu contains only numbering fields.
The menu contains only numbering fields.

You can use previously configured parameters in the formulas for further parameters' settings.
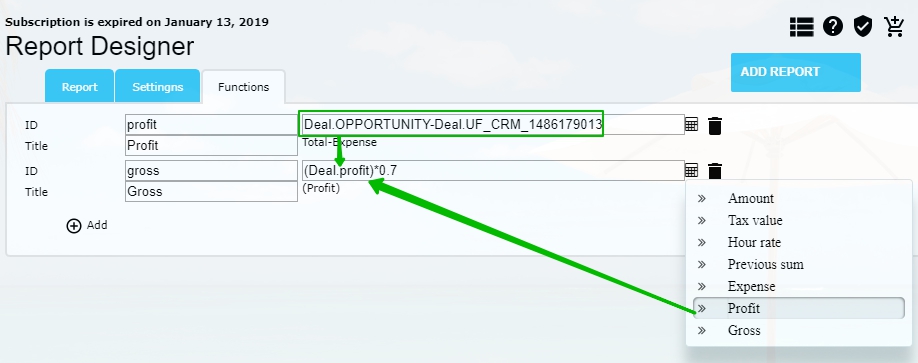
Important: previously calculated parameter should be placed in the following parameter configuration field in parenthesis. Otherwise calculation result will be incorrect.
For example, (Deal.profit)*0.7 = (Deal.OPPORTUNITY-UF_CRM_1486179013) * 0.7
If the following setting will be done - Deal.profit*0.7, this will mean Deal.OPPORTUNITY-UF_CRM_1486179013 * 0.7.
As you see, the second formula has different meaning.
Important: all formulas are calculated strictly in accordance with the order they were configured "top to bottom".
